University project
Extracting PDF Tables
A 2021 university project that finds tables in PDF annual reports with YOLOv3 and reads them with Camelot.
In 2021 I worked on a university industry project, where our team was asked to build a system to extract financial data from company annual reports. These reports are readily available online, but they are published as PDF and commonly run in excess of a hundred pages, and pulling the figures out of them by hand is slow work. I was responsible for the back end: the research into how the extraction could be done, the extraction engine and API themselves, and most of the project’s documentation. Our approach was to reverse the design process Adobe had followed in creating PDF. Where Adobe had set out to create digital paper to store information, we set out to create a digital reader to extract it; a system that would first look at a page, as a person does, to find where a table is, and only then read what it contains.
When I began researching the problem, I found that parsing data out of a digital document generally follows one of two approaches. The first is text extraction: reading the document as a person would, line by line and left to right, and taking the text as it appears. The second is to use the document’s underlying logical framework to locate the elements and structures within it, in the way that HTML gives each table its own tags. Both work well enough for most document types, but I found that PDF defeats them both. Its underlying structure has little correlation with its visual layout. A page is a set of glyphs and lines, each placed at a coordinate within a bounding box, and nowhere in that structure is there anything that corresponds to a table. What we see as rows and columns is, to the file itself, only text that happens to sit in alignment.
Ultimately it was a university project, and while it won best capstone project for that year, it was never fully finished nor refined. Recently I decided to return to it and finish off the things I wish I had had time for then: a proper front-end web UI and additional, alternative table extraction strategies.
Looking before reading
The engine treats each page as an image. A person finds a table by its shape, and an object detection model can be trained to do the same. I used YOLO, which predicts the class and bounding box of every object in an image in a single pass (Redmon et al. 2016); the box it returns is the region to read. I did not train the detector myself. Ismail Mebsout had already fine-tuned a small YOLOv3 model (Redmon & Farhadi 2018), built on the Ultralytics implementation (Ultralytics 2020), to find tables in PDF pages (Mebsout 2020). His model and method are the core of the engine, and I built the engine and API around them.
Each page goes through five steps:
- Read the page’s dimensions from the PDF with PyPDF2.
- Convert the page to an image and read the image’s dimensions.
- Pass the image to YOLOv3, which returns a bounding box for each table it finds.
- Convert each box from image coordinates to PDF coordinates.
- Pass the page and the converted boxes to Camelot, a Python library that reads each region into a dataframe for export as CSV and JSON.
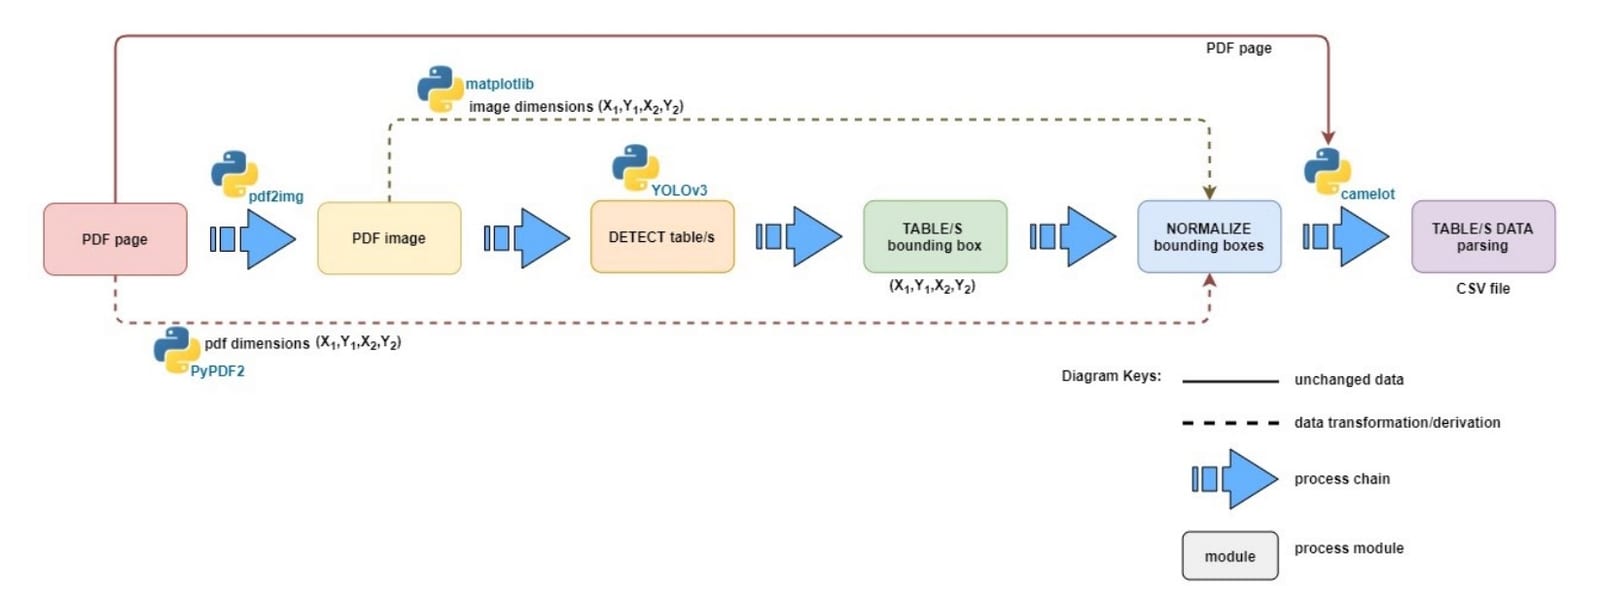
The fourth step is where the two views of the page meet. An image measures from its top-left corner in pixels and a PDF from its bottom-left corner in points, so each box is normalised against the image, scaled to the page, and flipped vertically. Following Mebsout, each box is also padded on every side, most of all at the bottom. Camelot reads each region in its stream mode, which infers columns from whitespace, and any result with fewer than two rows or two columns is discarded.
A 184-page report took just over twelve minutes to process. The pages are independent of each other, so I ran them in parallel: threads cut the run to about four minutes, and separate processes to under two and a half, roughly five times faster.
The brief set one design constraint: no user involvement between uploading a report and downloading the results. Whatever the detector found was extracted, and whatever it missed was lost.
Measuring it
We tested detection and parsing separately. For detection, we counted the tables in each document, the tables the detector missed, and its false positives:
| Document | Confidence threshold | Tables expected | Missed | False positives | Result |
|---|---|---|---|---|---|
| ANZ annual report 2018 | 30% | 125 | 15 | 10 | 80.0%* |
| ABC annual report 2018 | 30% | 104 | 20 | 0 | 80.8% |
| FXJ annual report 2018 | 24% | 143 | 32 | 1 | 76.9%* |
| Sample table set | 24% | 109 | 10 | 1 | 90% |
| IEL annual report 2018 | 24% | 106 | 5 | 2 | 93% |
* Recalculated. The result is the tables expected, less those missed and the false positives, as a share of the tables expected. The project's documentation gives 79.2% for the ANZ report and 83% for the FXJ report, which do not follow from its own counts.
We counted a result above 80% as good. Three documents cleared it, and the ANZ report fell exactly on the line. The later runs used a lower confidence threshold, 24% rather than 30%.
For parsing, we compared Camelot’s own report, which gives percentages for accuracy and whitespace, with a visual check of eight tables from the ANZ report. Three passed. Two were accepted with faults: one took in an extra line, and one split cells that span several columns. Three failed: two were infographics the detector had taken for tables, and one table without clear column divisions was read as a single column. Camelot scored that single column at 100% accuracy and 0% whitespace, and the infographics at about 89% and 96%. Only the visual check caught them.
Where it stood
By the end of the project the system did what the brief asked. A user could upload a report through the website or the API and get its tables back as CSV, JSON, or a single archive. The back end passed every user story the client had set.
The approach held up: where the detector placed a table correctly, Camelot usually read it well. The weaknesses were in detection, which missed more than one table in five on the weakest report and sometimes took infographics for tables, and in the output, since CSV flattens cells that span columns. Nothing in the system could flag these failures, and the user had no way to correct them. We had many ideas for improving the engine, but ultimately ran out of time for further refinement.
See this engine extended as Tablescan →
View automated-PDF-tabulated-data-extractor-api on GitHub →
References
Mebsout, I 2020, Parsing-PDFs-using-YOLOV3, GitHub repository.
Redmon, J, Divvala, S, Girshick, R & Farhadi, A 2016, ‘You Only Look Once: Unified, Real-Time Object Detection’, Proceedings of the IEEE Conference on Computer Vision and Pattern Recognition, pp. 779–788.
Redmon, J & Farhadi, A 2018, ‘YOLOv3: An Incremental Improvement’, arXiv preprint, arXiv:1804.02767.
Ultralytics 2020, YOLOv3 in PyTorch, GitHub repository.